Profiling and optimizing applications
This article present how to use tools available under Haiku to analyze performance of Haiku applications in order to Optimize them.
Tools used in this tutorial :
- profile
- c++filt
- QCachegrind
The first two comes with Haiku. The latest need to be installed using HaikuDepot (GUI) or pkgman (command line).
Overview of the process
This is basically a three steps process:
- identify a scenario that appears to be slow
- measure the performance using profile
- analyze results using QCachegrind
Measure
profile is a >>`sample-based profiler<https://nikhilism.com/post/2018/sampling-profiler-internals-introduction/>`_<<: this tool stops the measured process at regular intervals, and looks at the call stack at this point. The more you stop in a specified function, the more likely this function eats CPU.
All data is consolidated and written in the output directory.
The -v option generates data in a format suitable for QCachegrind that we will use later.
Example:
This example generates one file per thread. Depending on what you are looking for, you might prefer to have everything in one file. You can do this using the -S option:
Then, you should replay your test case in the launched application. When you close it, measures are written in output directory specified with the -v option.
More options in profile are available. See profile –help
Tips
Haiku is mainly written in C++. Function names in C++ binaries are encoded using a specific scheme. This process is called >>`mangling<https://en.wikipedia.org/wiki/Name_mangling>`_<<. In order to have more readable functions name in the analysis, you can use C++filt to pre-process result’s files.
example :
Analyze
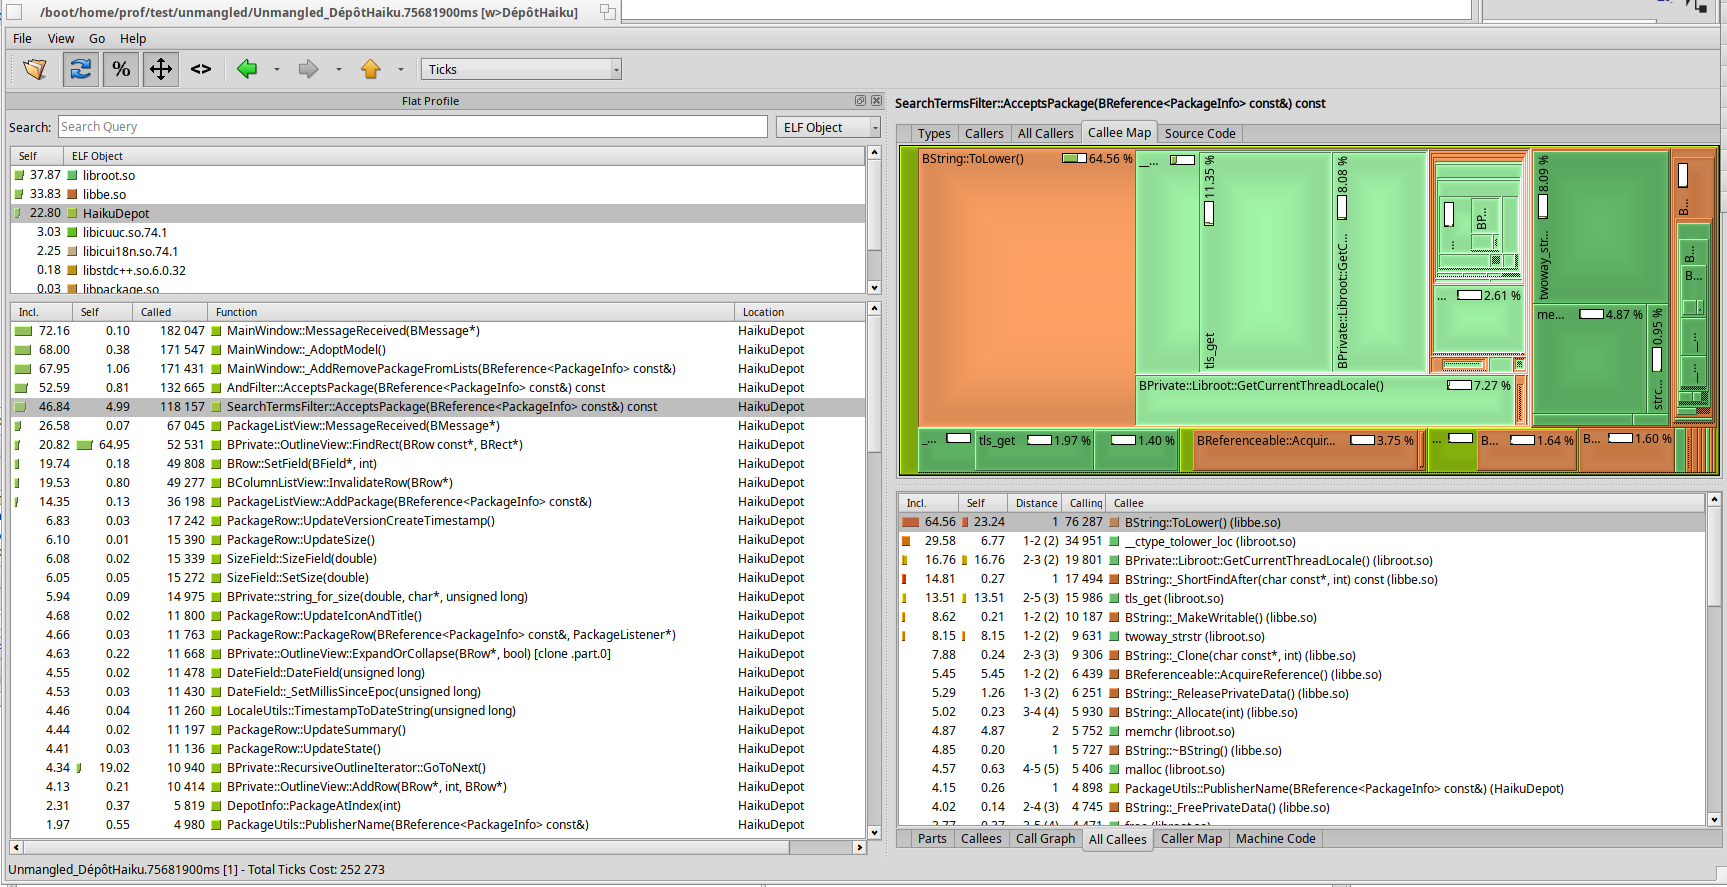
Finally, you should start QCachegrind. From there, open the unmangled_measure_file that you have generated at the previous step.
Here, the SearchTermsFilter::AcceptsPackage is hit in 46 % of the samples (first column on the left). If you look on the right view, the callee map shows all functions called from AcceptsPackage with a proportional area. Graphically, we see that ToLower is hit almost 65 % of the time.
The result of this analysis is that you should look at this part of the code to identify a way to optimize this path.
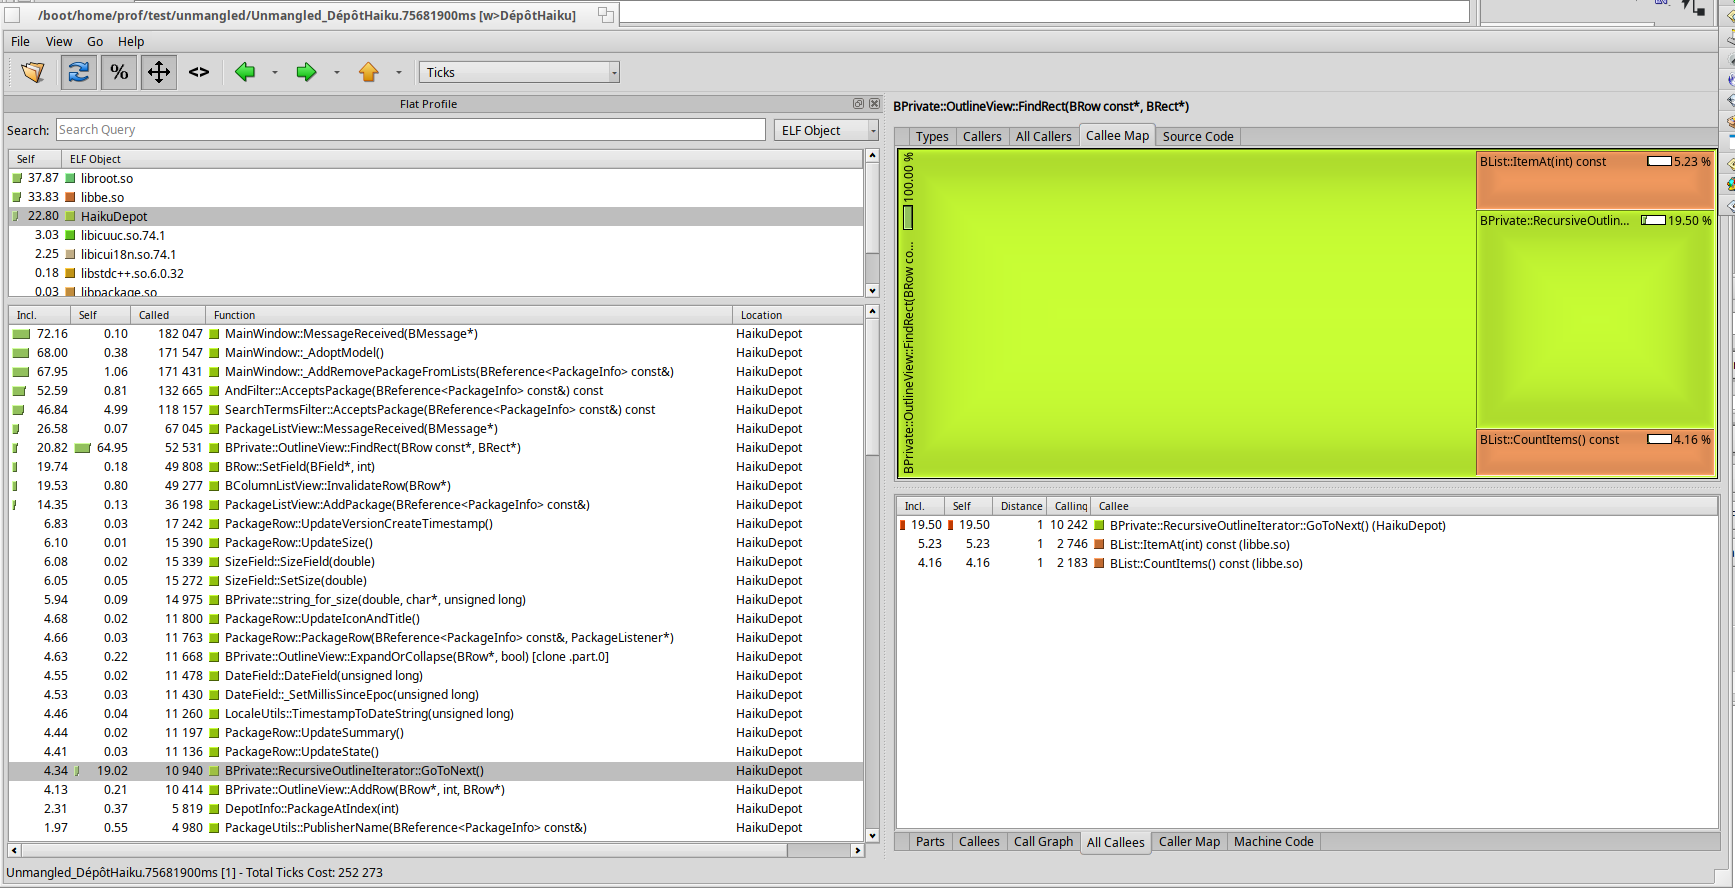
qcachegrind_analyze_findrect.png
This view shows another frequent case: the OutlineView::FindRect function has a large Self %: almost 65 % (large green rectangle). This pinpoints the fact that most of the time, we stop in the function itself, not in a subfunction. Maybe, there is something to investigate in the implementation of this function. Or maybe this function is called too often.