f3s: Kubernetes with FreeBSD - Part 8: Observability
Published at 2025-12-06T23:58:24+02:00, last updated Mon 09 Mar 09:33:08 EET 2026
This is the 8th blog post about the f3s series for my self-hosting demands in a home lab. f3s? The "f" stands for FreeBSD, and the "3s" stands for k3s, the Kubernetes distribution I use on FreeBSD-based physical machines.
2024-11-17 f3s: Kubernetes with FreeBSD - Part 1: Setting the stage
2024-12-03 f3s: Kubernetes with FreeBSD - Part 2: Hardware and base installation
2025-02-01 f3s: Kubernetes with FreeBSD - Part 3: Protecting from power cuts
2025-04-05 f3s: Kubernetes with FreeBSD - Part 4: Rocky Linux Bhyve VMs
2025-05-11 f3s: Kubernetes with FreeBSD - Part 5: WireGuard mesh network
2025-07-14 f3s: Kubernetes with FreeBSD - Part 6: Storage
2025-10-02 f3s: Kubernetes with FreeBSD - Part 7: k3s and first pod deployments
2025-12-07 f3s: Kubernetes with FreeBSD - Part 8: Observability (You are currently reading this)
2025-12-14 f3s: Kubernetes with FreeBSD - Part 8b: Distributed Tracing with Tempo
2026-04-02 f3s: Kubernetes with FreeBSD - Part 9: GitOps with ArgoCD
Table of Contents
- ⇢ f3s: Kubernetes with FreeBSD - Part 8: Observability
- ⇢ ⇢ Introduction
- ⇢ ⇢ Important Note: GitOps Migration
- ⇢ ⇢ Persistent storage recap
- ⇢ ⇢ The monitoring namespace
- ⇢ ⇢ Installing Prometheus and Grafana
- ⇢ ⇢ ⇢ Prerequisites
- ⇢ ⇢ ⇢ Deploying with the Justfile
- ⇢ ⇢ ⇢ Exposing Grafana via ingress
- ⇢ ⇢ Installing Loki and Alloy
- ⇢ ⇢ ⇢ Prerequisites
- ⇢ ⇢ ⇢ Deploying Loki and Alloy
- ⇢ ⇢ ⇢ Configuring Alloy
- ⇢ ⇢ ⇢ Adding Loki as a Grafana data source
- ⇢ ⇢ The complete monitoring stack
- ⇢ ⇢ Using the observability stack
- ⇢ ⇢ ⇢ Viewing metrics in Grafana
- ⇢ ⇢ ⇢ Querying logs with LogQL
- ⇢ ⇢ ⇢ Creating alerts
- ⇢ ⇢ Monitoring external FreeBSD hosts
- ⇢ ⇢ ⇢ Installing Node Exporter on FreeBSD
- ⇢ ⇢ ⇢ Adding FreeBSD hosts to Prometheus
- ⇢ ⇢ ⇢ FreeBSD memory metrics compatibility
- ⇢ ⇢ ⇢ Disk I/O metrics limitation
- ⇢ ⇢ ZFS Monitoring for FreeBSD Servers
- ⇢ ⇢ ⇢ Node Exporter ZFS Collector
- ⇢ ⇢ ⇢ Verifying ZFS Metrics
- ⇢ ⇢ ⇢ ZFS Recording Rules
- ⇢ ⇢ ⇢ Grafana Dashboards
- ⇢ ⇢ ⇢ Deployment
- ⇢ ⇢ ⇢ Verifying ZFS Metrics in Prometheus
- ⇢ ⇢ ⇢ Key Metrics to Monitor
- ⇢ ⇢ ⇢ ZFS Pool and Dataset Metrics via Textfile Collector
- ⇢ ⇢ Monitoring external OpenBSD hosts
- ⇢ ⇢ ⇢ Installing Node Exporter on OpenBSD
- ⇢ ⇢ ⇢ Adding OpenBSD hosts to Prometheus
- ⇢ ⇢ ⇢ OpenBSD memory metrics compatibility
- ⇢ ⇢ Summary
Introduction
In this blog post, I set up a complete observability stack for the k3s cluster. Observability is crucial for understanding what's happening inside the cluster—whether its tracking resource usage, debugging issues, or analysing application behaviour. The stack consists of five main components, all deployed into the `monitoring` namespace:
- Prometheus: time-series database for metrics collection and alerting
- Grafana: visualisation and dashboarding frontend
- Loki: log aggregation system (like Prometheus, but for logs)
- Alloy: telemetry collector that ships logs and traces from all pods to Loki and Tempo
- Tempo: distributed tracing backend for request flow analysis across microservices
Together, these form the "PLG" stack (Prometheus, Loki, Grafana) extended with Tempo for distributed tracing, which is a popular open-source alternative to commercial observability platforms.
All manifests for the f3s stack live in my configuration repository:
Important Note: GitOps Migration
**Note:** After publishing this blog post, the f3s cluster was migrated from imperative Helm deployments to declarative GitOps using ArgoCD. The Kubernetes manifests, Helm charts, and Justfiles in the repository have been reorganized for ArgoCD-based continuous deployment.
**To view the exact configuration as it existed when this blog post was written** (before the ArgoCD migration), check out the pre-ArgoCD revision:
**Current master branch** contains the ArgoCD-managed versions with:
- Application manifests organized under `argocd-apps/{monitoring,services,infra,test}/`
- Resources organized under `prometheus/manifests/`, `loki/`, etc.
- Justfiles updated to trigger ArgoCD syncs instead of direct Helm commands
The deployment concepts and architecture remain the same—only the deployment method changed from imperative (`helm install/upgrade`) to declarative (GitOps with ArgoCD).
Persistent storage recap
All observability components need persistent storage so that metrics and logs survive pod restarts. As covered in Part 6 of this series, the cluster uses NFS-backed persistent volumes:
f3s: Kubernetes with FreeBSD - Part 6: Storage
The FreeBSD hosts (`f0`, `f1`) serve as master-standby NFS servers, exporting ZFS datasets that are replicated across hosts using `zrepl`. The Rocky Linux k3s nodes (`r0`, `r1`, `r2`) mount these exports at `/data/nfs/k3svolumes`. This directory contains subdirectories for each application that needs persistent storage—including Prometheus, Grafana, and Loki.
For example, the observability stack uses these paths on the NFS share:
- `/data/nfs/k3svolumes/prometheus/data` — Prometheus time-series database
- `/data/nfs/k3svolumes/grafana/data` — Grafana configuration, dashboards, and plugins
- `/data/nfs/k3svolumes/loki/data` — Loki log chunks and index
- `/data/nfs/k3svolumes/tempo/data` — Tempo trace data and WAL
Each path gets a corresponding `PersistentVolume` and `PersistentVolumeClaim` in Kubernetes, allowing pods to mount them as regular volumes. Because the underlying storage is ZFS with replication, we get snapshots and redundancy for free.
The monitoring namespace
First, I created the monitoring namespace where all observability components will live:
Installing Prometheus and Grafana
Prometheus and Grafana are deployed together using the `kube-prometheus-stack` Helm chart from the Prometheus community. This chart bundles Prometheus, Grafana, Alertmanager, and various exporters (Node Exporter, Kube State Metrics) into a single deployment. Ill explain what each component does in detail later when we look at the running pods.
Prerequisites
Add the Prometheus Helm chart repository:
Create the directories on the NFS server for persistent storage:
Deploying with the Justfile
The configuration repository contains a `Justfile` that automates the deployment. `just` is a handy command runner—think of it as a simpler, more modern alternative to `make`. I use it throughout the f3s repository to wrap repetitive Helm and kubectl commands:
just - A handy way to save and run project-specific commands
codeberg.org/snonux/conf/f3s/prometheus
To install everything:
The `persistence-values.yaml` configures Prometheus and Grafana to use the NFS-backed persistent volumes I mentioned earlier, ensuring data survives pod restarts. It also enables scraping of etcd and kube-controller-manager metrics:
By default, k3s binds the controller-manager to localhost only and doesn't expose etcd metrics, so the "Kubernetes / Controller Manager" and "etcd" dashboards in Grafana will show no data. To fix both, add the following to `/etc/rancher/k3s/config.yaml` on each k3s server node:
Repeat for `r1` and `r2`. After restarting all nodes, the controller-manager metrics endpoint will be accessible and etcd metrics are available on port 2381. Prometheus can now scrape both.
Verify etcd metrics are exposed:
The full `persistence-values.yaml` and all other Prometheus configuration files are available on Codeberg:
codeberg.org/snonux/conf/f3s/prometheus
The persistent volume definitions bind to specific paths on the NFS share using `hostPath` volumes—the same pattern used for other services in Part 7:
f3s: Kubernetes with FreeBSD - Part 7: k3s and first pod deployments
Exposing Grafana via ingress
The chart also deploys an ingress for Grafana, making it accessible at `grafana.f3s.foo.zone`. The ingress configuration follows the same pattern as other services in the cluster—Traefik handles the routing internally, while the OpenBSD edge relays terminate TLS and forward traffic through WireGuard.
Once deployed, Grafana is accessible and comes pre-configured with Prometheus as a data source. You can verify the Prometheus service is running:
Grafana connects to Prometheus using the internal service URL `http://prometheus-kube-prometheus-prometheus.monitoring.svc.cluster.local:9090`. The default Grafana credentials are `admin`/`prom-operator`, which should be changed immediately after first login.
Grafana dashboard showing Prometheus metrics
Grafana dashboard showing cluster metrics
Installing Loki and Alloy
While Prometheus handles metrics, Loki handles logs. It's designed to be cost-effective and easy to operate—it doesn't index the contents of logs, only the metadata (labels), making it very efficient for storage.
Alloy is Grafana's telemetry collector (the successor to Promtail). It runs as a DaemonSet on each node, tails container logs, and ships them to Loki.
Prerequisites
Create the data directory on the NFS server:
Deploying Loki and Alloy
The Loki configuration also lives in the repository:
codeberg.org/snonux/conf/f3s/loki
To install:
Loki runs in single-binary mode with a single replica (`loki-0`), which is appropriate for a home lab cluster. This means there's only one Loki pod running at any time. If the node hosting Loki fails, Kubernetes will automatically reschedule the pod to another worker node—but there will be a brief downtime (typically under a minute) while this happens. For my home lab use case, this is perfectly acceptable.
For full high-availability, you'd deploy Loki in microservices mode with separate read, write, and backend components, backed by object storage like S3 or MinIO instead of local filesystem storage. That's a more complex setup that I might explore in a future blog post—but for now, the single-binary mode with NFS-backed persistence strikes the right balance between simplicity and durability.
Configuring Alloy
Alloy is configured via `alloy-values.yaml` to discover all pods in the cluster and forward their logs to Loki:
This configuration automatically labels each log line with the namespace, pod name, container name, and app label, making it easy to filter logs in Grafana.
Adding Loki as a Grafana data source
Loki doesn't have its own web UI—you query it through Grafana. First, verify the Loki service is running:
To add Loki as a data source in Grafana:
- Navigate to Configuration → Data Sources
- Click "Add data source"
- Select "Loki"
- Set the URL to: `http://loki.monitoring.svc.cluster.local:3100`
- Click "Save & Test"
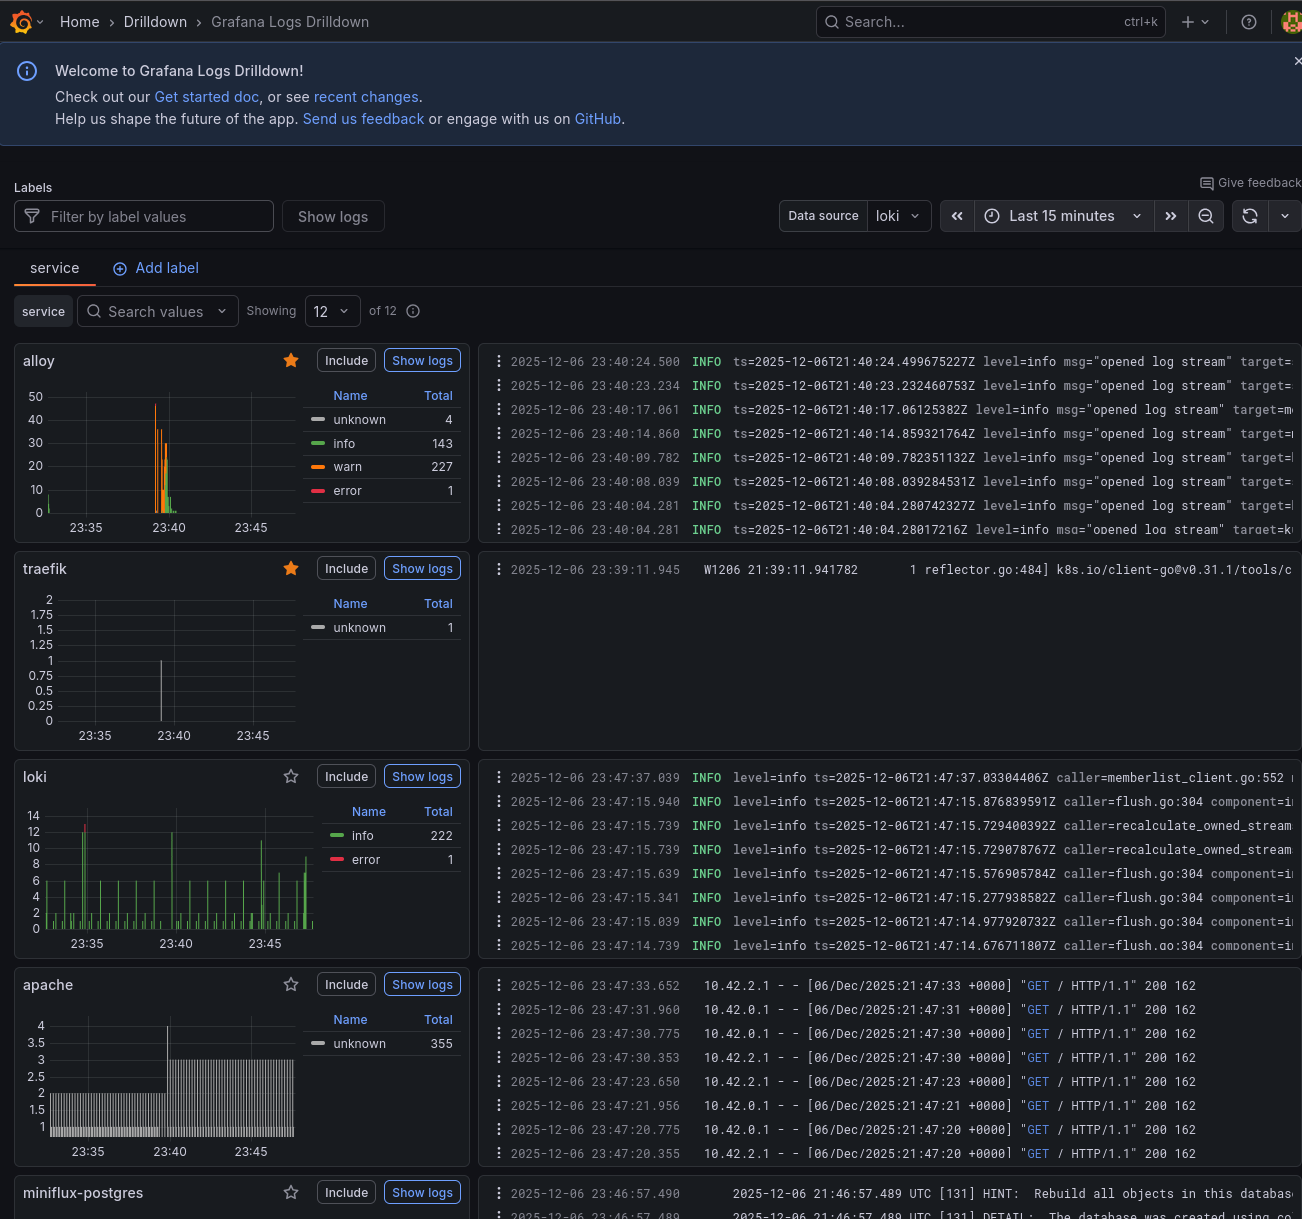
Once configured, you can explore logs in Grafana's "Explore" view. I'll show some example queries in the "Using the observability stack" section below.
Exploring logs in Grafana with Loki
The complete monitoring stack
After deploying everything, here's what's running in the monitoring namespace:
Note: Tempo (`tempo-0`) is deployed later in this post in the "Distributed Tracing with Grafana Tempo" section. It is included in the pod listing here for completeness.
And the services:
Let me break down what each pod does:
- `alertmanager-prometheus-kube-prometheus-alertmanager-0`: the Alertmanager instance that receives alerts from Prometheus, deduplicates them, groups related alerts together, and routes notifications to the appropriate receivers (email, Slack, PagerDuty, etc.). It runs as a StatefulSet with persistent storage for silences and notification state.
- `alloy-g5fgj, alloy-nfw8w, alloy-tg9vj`: three Alloy pods running as a DaemonSet, one on each k3s node. Each pod tails the container logs from its local node via the Kubernetes API and forwards them to Loki. This ensures log collection continues even if a node becomes isolated from the others.
- `loki-0`: the single Loki instance running in single-binary mode. It receives log streams from Alloy, stores them in chunks on the NFS-backed persistent volume, and serves queries from Grafana. The `-0` suffix indicates it's a StatefulSet pod.
- `prometheus-grafana-...`: the Grafana web interface for visualising metrics and logs. It comes pre-configured with Prometheus as a data source and includes dozens of dashboards for Kubernetes monitoring. Dashboards, users, and settings are persisted to the NFS share.
- `prometheus-kube-prometheus-operator-...`: the Prometheus Operator that watches for custom resources (ServiceMonitor, PodMonitor, PrometheusRule) and automatically configures Prometheus to scrape new targets. This allows applications to declare their own monitoring requirements.
- `prometheus-kube-state-metrics-...`: generates metrics about the state of Kubernetes objects themselves: how many pods are running, pending, or failed; deployment replica counts; node conditions; PVC status; and more. Essential for cluster-level dashboards.
- `prometheus-prometheus-kube-prometheus-prometheus-0`: the Prometheus server that scrapes metrics from all configured targets (pods, services, nodes), stores them in a time-series database, evaluates alerting rules, and serves queries to Grafana.
- `prometheus-prometheus-node-exporter-...`: three Node Exporter pods running as a DaemonSet, one on each node. They expose hardware and OS-level metrics: CPU usage, memory, disk I/O, filesystem usage, network statistics, and more. These feed the "Node Exporter" dashboards in Grafana.
- `tempo-0`: the Grafana Tempo instance for distributed tracing. It receives trace data from Alloy via OTLP (OpenTelemetry Protocol), stores traces on the NFS-backed persistent volume, and serves queries to Grafana. Tempo is covered in detail in the "Distributed Tracing with Grafana Tempo" section later in this post.
Using the observability stack
Viewing metrics in Grafana
The kube-prometheus-stack comes with many pre-built dashboards. Some useful ones include:
- Kubernetes / Compute Resources / Cluster: overview of CPU and memory usage across the cluster
- Kubernetes / Compute Resources / Namespace (Pods): resource usage by namespace
- Node Exporter / Nodes: detailed host metrics like disk I/O, network, and CPU
Querying logs with LogQL
In Grafana's Explore view, select Loki as the data source and try queries like:
Creating alerts
Prometheus supports alerting rules that can notify you when something goes wrong. The kube-prometheus-stack includes many default alerts for common issues like high CPU usage, pod crashes, and node problems. These can be customised via PrometheusRule CRDs.
Monitoring external FreeBSD hosts
The observability stack can also monitor servers outside the Kubernetes cluster. The FreeBSD hosts (`f0`, `f1`, `f2`) that serve NFS storage can be added to Prometheus using the Node Exporter.
Installing Node Exporter on FreeBSD
On each FreeBSD host, install the node_exporter package:
Enable the service to start at boot:
Configure node_exporter to listen on the WireGuard interface. This ensures metrics are only accessible through the secure tunnel, not the public network. Replace the IP with the host's WireGuard address:
Start the service:
Verify it's running:
Repeat for the other FreeBSD hosts (`f1`, `f2`) with their respective WireGuard IPs.
Adding FreeBSD hosts to Prometheus
Create a file `additional-scrape-configs.yaml` in the prometheus configuration directory:
The `job_name` must be `node-exporter` to match the existing dashboards. The `os: freebsd` label allows filtering these hosts separately if needed.
Create a Kubernetes secret from this file:
Update `persistence-values.yaml` to reference the secret:
Upgrade the Prometheus deployment:
After a minute or so, the FreeBSD hosts appear in the Prometheus targets and in the Node Exporter dashboards in Grafana.
FreeBSD hosts in the Node Exporter dashboard
FreeBSD memory metrics compatibility
The default Node Exporter dashboards are designed for Linux and expect metrics like `node_memory_MemAvailable_bytes`. FreeBSD uses different metric names (`node_memory_size_bytes`, `node_memory_free_bytes`, etc.), so memory panels will show "No data" out of the box.
To fix this, I created a PrometheusRule that generates synthetic Linux-compatible metrics from the FreeBSD equivalents:
This file is saved as `freebsd-recording-rules.yaml` and applied as part of the Prometheus installation. The `os="freebsd"` label (set in the scrape config) ensures these rules only apply to FreeBSD hosts. After applying, the memory panels in the Node Exporter dashboards populate correctly for FreeBSD.
freebsd-recording-rules.yaml on Codeberg
Disk I/O metrics limitation
Unlike memory metrics, disk I/O metrics (`node_disk_read_bytes_total`, `node_disk_written_bytes_total`, etc.) are not available on FreeBSD. The Linux diskstats collector that provides these metrics doesn't have a FreeBSD equivalent in the node_exporter.
The disk I/O panels in the Node Exporter dashboards will show "No data" for FreeBSD hosts. FreeBSD does expose ZFS-specific metrics (`node_zfs_arcstats_*`) for ARC cache performance, and per-dataset I/O stats are available via `sysctl kstat.zfs`, but mapping these to the Linux-style metrics the dashboards expect is non-trivial. To address this, I created custom ZFS-specific dashboards, covered in the next section.
ZFS Monitoring for FreeBSD Servers
The FreeBSD servers (f0, f1, f2) that provide NFS storage to the k3s cluster have ZFS filesystems. Monitoring ZFS performance is crucial for understanding storage performance and cache efficiency.
Node Exporter ZFS Collector
The node_exporter running on each FreeBSD server (v1.9.1) includes a built-in ZFS collector that exposes metrics via sysctls. The ZFS collector is enabled by default and provides:
- ARC (Adaptive Replacement Cache) statistics
- Cache hit/miss rates
- Memory usage and allocation
- MRU/MFU cache breakdown
- Data vs metadata distribution
Verifying ZFS Metrics
On any FreeBSD server, check that ZFS metrics are being exposed:
The metrics are automatically scraped by Prometheus through the existing static configuration in additional-scrape-configs.yaml which targets all FreeBSD servers on port 9100 with the os: freebsd label.
ZFS Recording Rules
Created recording rules for easier dashboard consumption in zfs-recording-rules.yaml:
These recording rules calculate:
- ARC hit rate percentage
- ARC memory usage percentage (current vs maximum)
- ARC target percentage (target vs maximum)
- Metadata vs data percentages
- MRU vs MFU cache percentages
- Demand data and metadata hit rates
Grafana Dashboards
Created two comprehensive ZFS monitoring dashboards (zfs-dashboards.yaml):
**Dashboard 1: FreeBSD ZFS (per-host detailed view)**
Includes variables to select:
- FreeBSD server (f0, f1, or f2)
- ZFS pool (zdata, zroot, or all)
Pool Overview Row:
- Pool Capacity gauge (with thresholds: green <70%, yellow <85%, red >85%)
- Pool Health status (ONLINE/DEGRADED/FAULTED with color coding)
- Total Pool Size stat
- Free Space stat
- Pool Space Usage Over Time (stacked: used + free)
- Pool Capacity Trend time series
Dataset Statistics Row:
- Table showing all datasets with columns: Pool, Dataset, Used, Available, Referenced
- Automatically filters by selected pool
ARC Cache Statistics Row:
- ARC Hit Rate gauge (red <70%, yellow <90%, green >=90%)
- ARC Size time series (current, target, max)
- ARC Memory Usage percentage gauge
- ARC Hits vs Misses rate
- ARC Data vs Metadata stacked time series
**Dashboard 2: FreeBSD ZFS Summary (cluster-wide overview)**
Cluster-Wide Pool Statistics Row:
- Total Storage Capacity across all servers
- Total Used space
- Total Free space
- Average Pool Capacity gauge
- Pool Health Status (worst case across cluster)
- Total Pool Space Usage Over Time
- Per-Pool Capacity time series (all pools on all hosts)
Per-Host Pool Breakdown Row:
- Bar gauge showing capacity by host and pool
- Table with all pools: Host, Pool, Size, Used, Free, Capacity %, Health
Cluster-Wide ARC Statistics Row:
- Average ARC Hit Rate gauge across all hosts
- ARC Hit Rate by Host time series
- Total ARC Size Across Cluster
- Total ARC Hits vs Misses (cluster-wide sum)
- ARC Size by Host
Dashboard Visualization:
ZFS monitoring dashboard in Grafana showing pool capacity, health, and I/O throughput
ZFS ARC cache statistics showing hit rate, memory usage, and size trends
ZFS datasets table and ARC data vs metadata breakdown
Deployment
Applied the resources to the cluster:
Updated Justfile to include ZFS recording rules in install and upgrade targets:
Verifying ZFS Metrics in Prometheus
Check that ZFS metrics are being collected:
Check recording rules are calculating correctly:
Example output shows memory usage percentage for each FreeBSD server:
Key Metrics to Monitor
- ARC Hit Rate: Should typically be above 90% for optimal performance. Lower hit rates indicate the ARC cache is too small or workload has poor locality.
- ARC Memory Usage: Shows how much of the maximum ARC size is being used. If consistently at or near maximum, the ARC is effectively utilizing available memory.
- Data vs Metadata: Typically data should dominate, but workloads with many small files will show higher metadata percentages.
- MRU vs MFU: Most Recently Used vs Most Frequently Used cache. The ratio depends on workload characteristics.
- Pool Capacity: Monitor pool usage to ensure adequate free space. ZFS performance degrades when pools exceed 80% capacity.
- Pool Health: Should always show ONLINE (green). DEGRADED (yellow) indicates a disk issue requiring attention. FAULTED (red) requires immediate action.
- Dataset Usage: Track which datasets are consuming the most space to identify growth trends and plan capacity.
ZFS Pool and Dataset Metrics via Textfile Collector
To complement the ARC statistics from node_exporter's built-in ZFS collector, I added pool capacity and dataset metrics using the textfile collector feature.
Created a script at `/usr/local/bin/zfs_pool_metrics.sh` on each FreeBSD server:
Deployed to all FreeBSD servers:
Set up cron jobs to run every minute:
The textfile collector (already configured with --collector.textfile.directory=/var/tmp/node_exporter) automatically picks up the metrics.
Verify metrics are being exposed:
All ZFS-related configuration files are available on Codeberg:
zfs-recording-rules.yaml on Codeberg
zfs-dashboards.yaml on Codeberg
Monitoring external OpenBSD hosts
The same approach works for OpenBSD hosts. I have two OpenBSD edge relay servers (`blowfish`, `fishfinger`) that handle TLS termination and forward traffic through WireGuard to the cluster. These can also be monitored with Node Exporter.
Installing Node Exporter on OpenBSD
On each OpenBSD host, install the node_exporter package:
Enable the service to start at boot:
Configure node_exporter to listen on the WireGuard interface. This ensures metrics are only accessible through the secure tunnel, not the public network. Replace the IP with the host's WireGuard address:
Start the service:
Verify it's running:
Repeat for the other OpenBSD host (`fishfinger`) with its respective WireGuard IP (`192.168.2.111`).
Adding OpenBSD hosts to Prometheus
Update `additional-scrape-configs.yaml` to include the OpenBSD targets:
The `os: openbsd` label allows filtering these hosts separately from FreeBSD and Linux nodes.
OpenBSD memory metrics compatibility
OpenBSD uses the same memory metric names as FreeBSD (`node_memory_size_bytes`, `node_memory_free_bytes`, etc.), so a similar PrometheusRule is needed to generate Linux-compatible metrics:
This file is saved as `openbsd-recording-rules.yaml` and applied alongside the FreeBSD rules. Note that OpenBSD doesn't expose a buffer memory metric, so that rule is omitted.
openbsd-recording-rules.yaml on Codeberg
After running `just upgrade`, the OpenBSD hosts appear in Prometheus targets and the Node Exporter dashboards.
Summary
With Prometheus, Grafana, Loki, and Alloy deployed, I now have visibility into the k3s cluster, the FreeBSD storage servers, and the OpenBSD edge relays:
- Metrics: Prometheus collects and stores time-series data from all components, including etcd and ZFS
- Logs: Loki aggregates logs from all containers, searchable via Grafana
- Visualisation: Grafana provides dashboards and exploration tools
- Alerting: Alertmanager can notify on conditions defined in Prometheus rules
The next part covers the final pillar of observability: distributed tracing with Grafana Tempo.
Part 8b: Distributed Tracing with Tempo
All configuration files are available on Codeberg:
Prometheus, Grafana, and recording rules configuration
Other *BSD-related posts:
2026-04-02 f3s: Kubernetes with FreeBSD - Part 9: GitOps with ArgoCD
2025-12-14 f3s: Kubernetes with FreeBSD - Part 8b: Distributed Tracing with Tempo
2025-12-07 f3s: Kubernetes with FreeBSD - Part 8: Observability (You are currently reading this)
2025-10-02 f3s: Kubernetes with FreeBSD - Part 7: k3s and first pod deployments
2025-07-14 f3s: Kubernetes with FreeBSD - Part 6: Storage
2025-05-11 f3s: Kubernetes with FreeBSD - Part 5: WireGuard mesh network
2025-04-05 f3s: Kubernetes with FreeBSD - Part 4: Rocky Linux Bhyve VMs
2025-02-01 f3s: Kubernetes with FreeBSD - Part 3: Protecting from power cuts
2024-12-03 f3s: Kubernetes with FreeBSD - Part 2: Hardware and base installation
2024-11-17 f3s: Kubernetes with FreeBSD - Part 1: Setting the stage
2024-04-01 KISS high-availability with OpenBSD
2024-01-13 One reason why I love OpenBSD
2022-10-30 Installing DTail on OpenBSD
2022-07-30 Let's Encrypt with OpenBSD and Rex
2016-04-09 Jails and ZFS with Puppet on FreeBSD
E-Mail your comments to `paul@nospam.buetow.org`